Wild Salmon Center’s new GIS Spatial Analyst will help us illuminate the case for salmon conservation across the North Pacific.
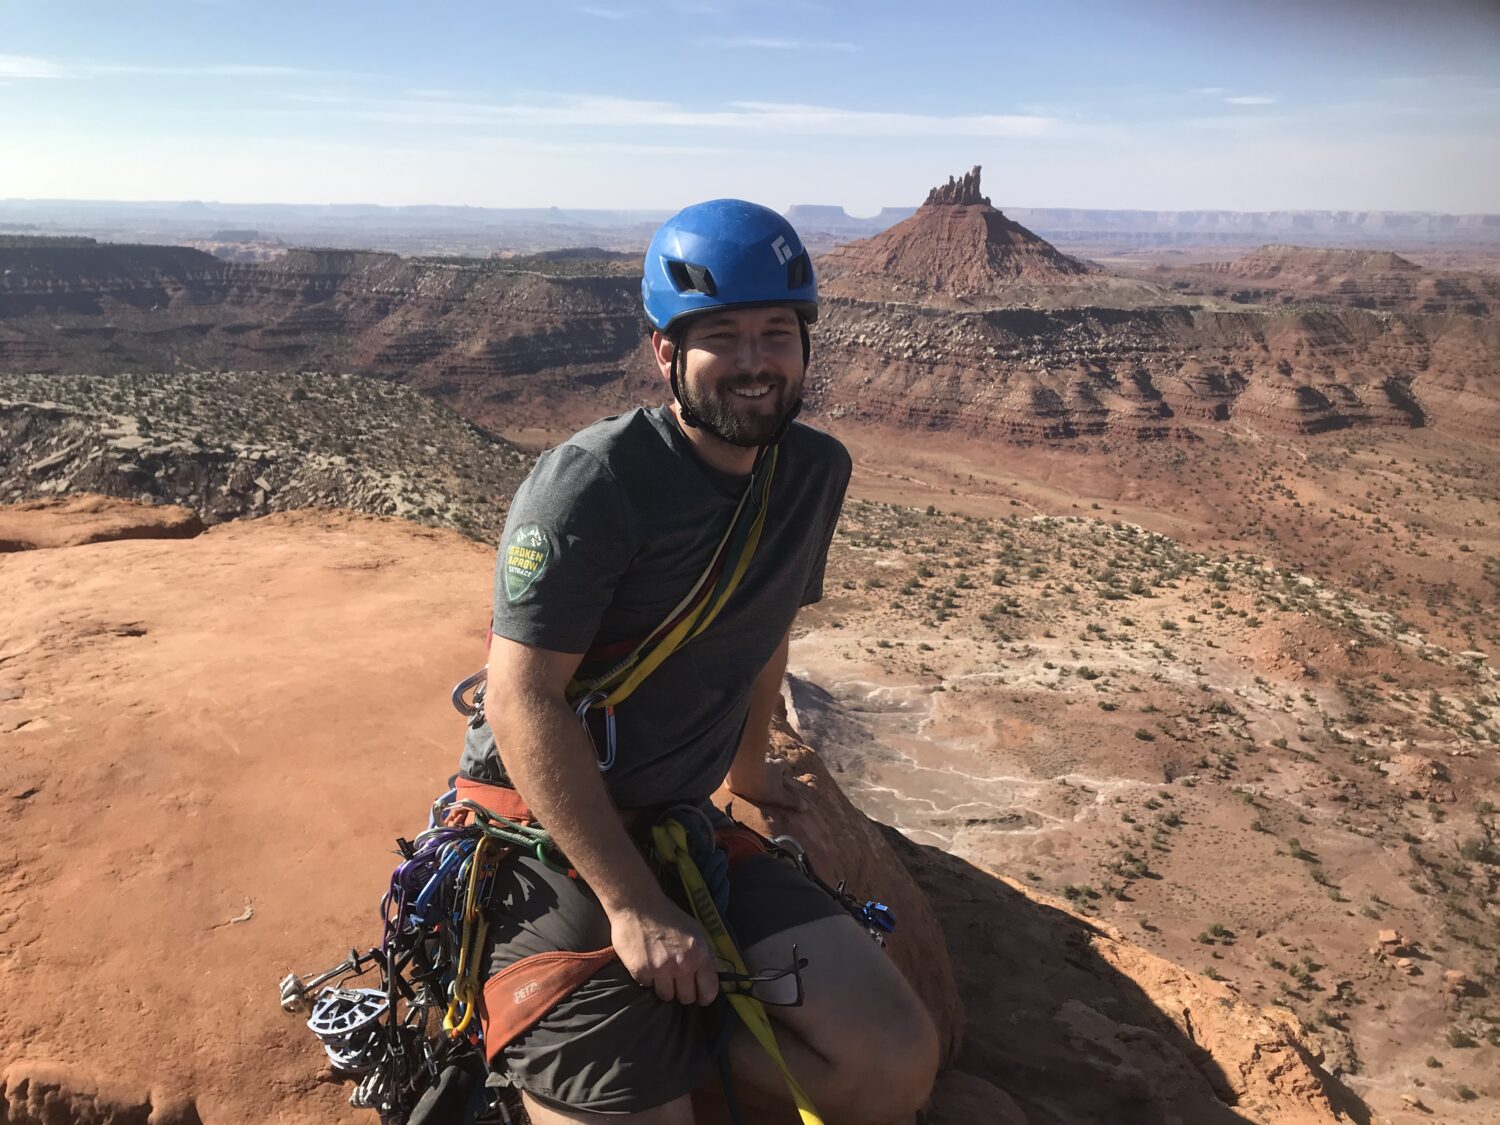
Back in 2018, Jon Hart spent a lot of time exploring Utah’s Bears Ears and Grand Staircase-Escalante National Monuments.

Working with a team of environmental consultants contracted by the Bureau of Land Management, Hart’s task was to chart the monuments’ forgotten infrastructure, culverts, and legacy road and trail networks. He merged these updated maps—drawn from both his field work and careful scrutiny of satellite imagery—with more data sets of sensitive habitats and species.
For Hart, it was an adventure, but one that came with a sense of heartbreak—knowing that his research informed BLM’s mandate to help draw the lines to downsize the monuments as ordered by the Trump Administration.
“There’s just nothing like some of these desert landscapes, these meccas,” he says. “I’ve always felt that the more land we can protect, the better—and that good maps, in a better situation, have real power to make that happen.”
Four years later, Hart is now wielding that storytelling power on behalf of Wild Salmon Center’s conservation work.
“I’ve always felt that the more land we can protect, the better—and that good maps, in a better situation, have real power to make that happen.”
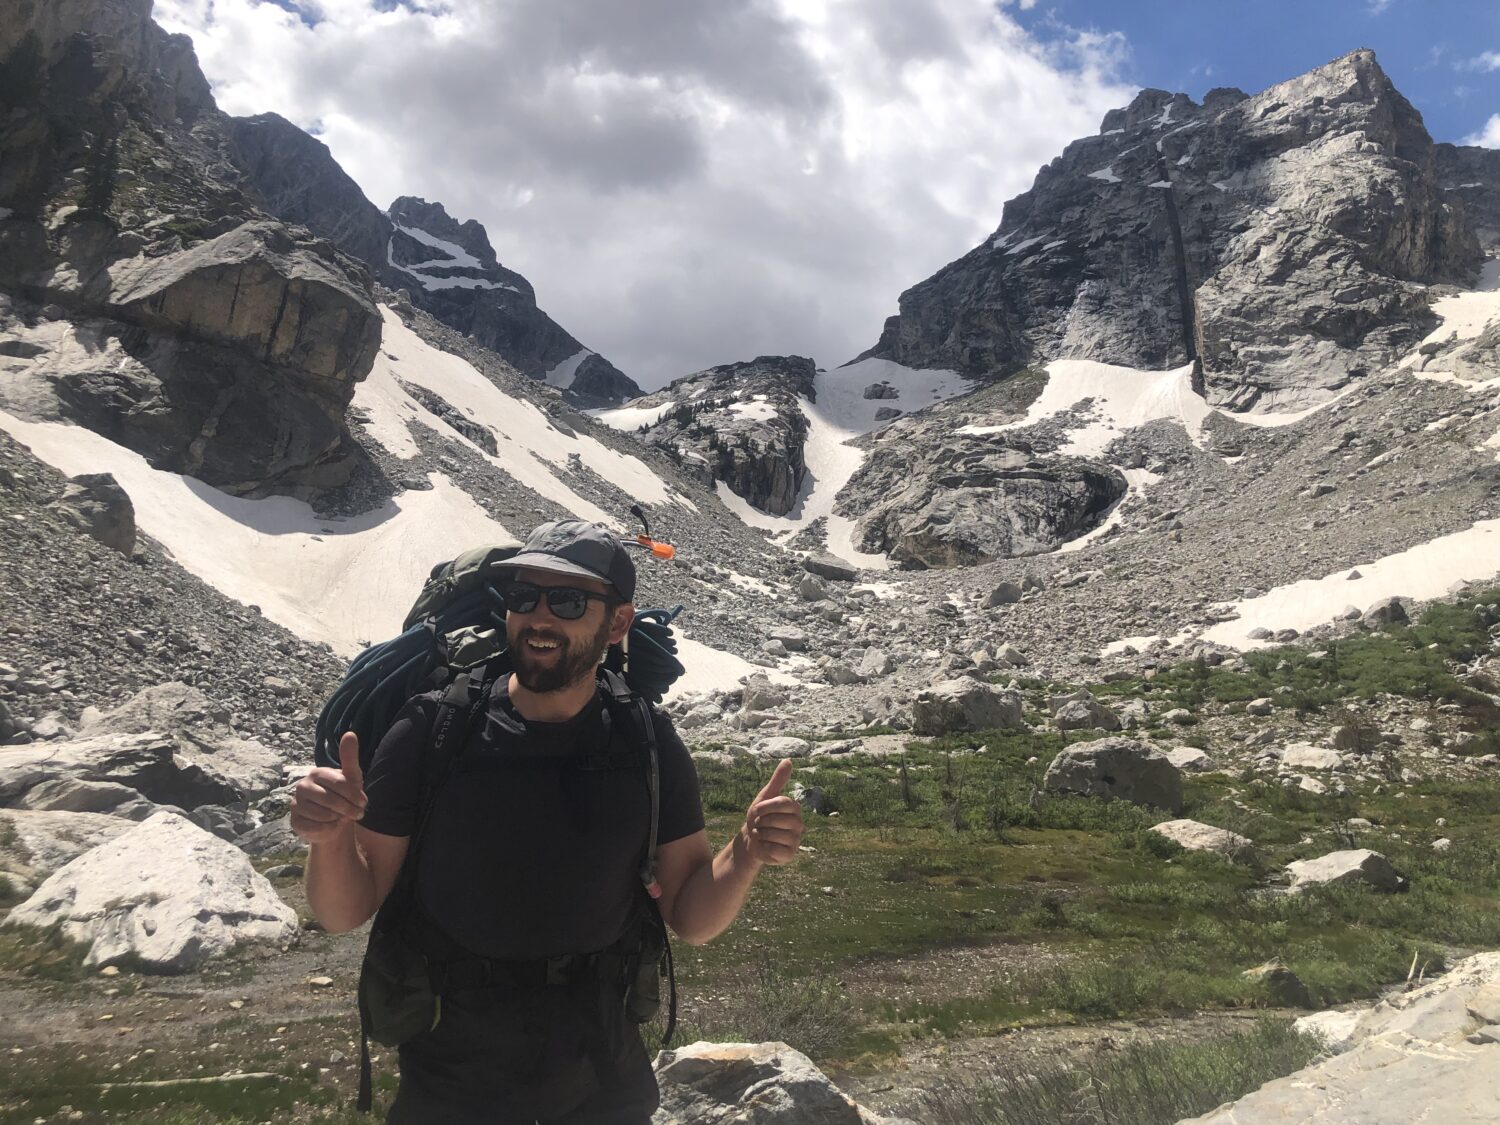
WSC GIS Spatial Analyst Jon Hart
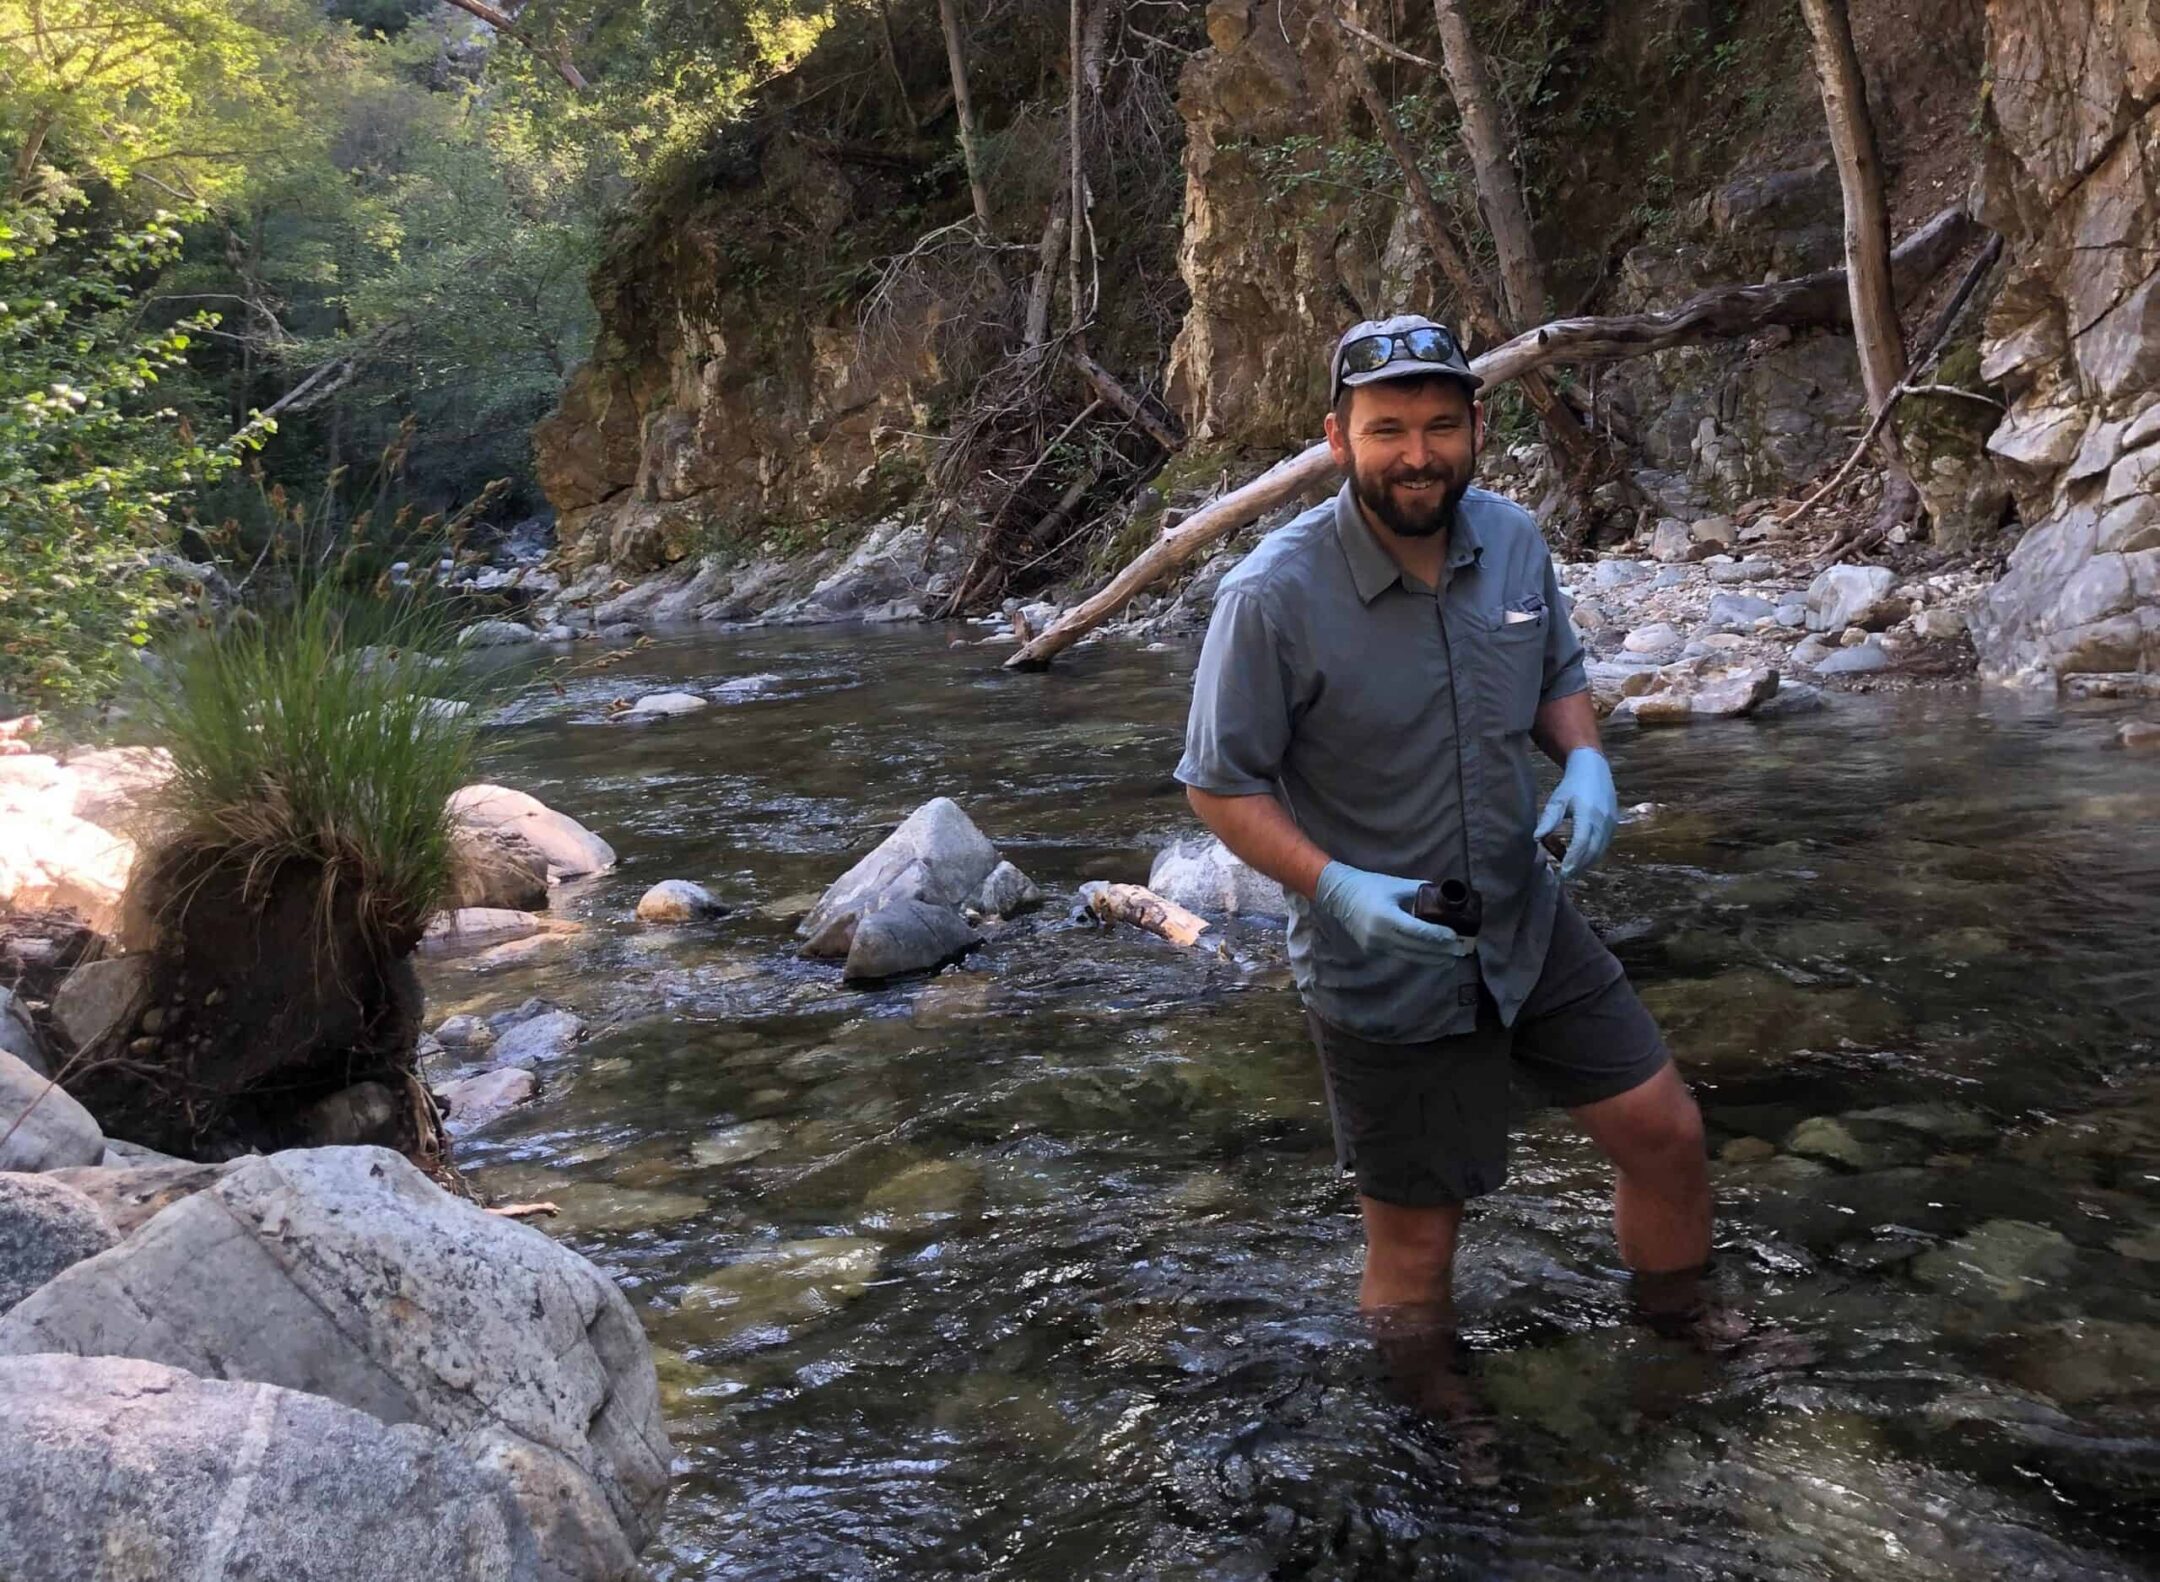
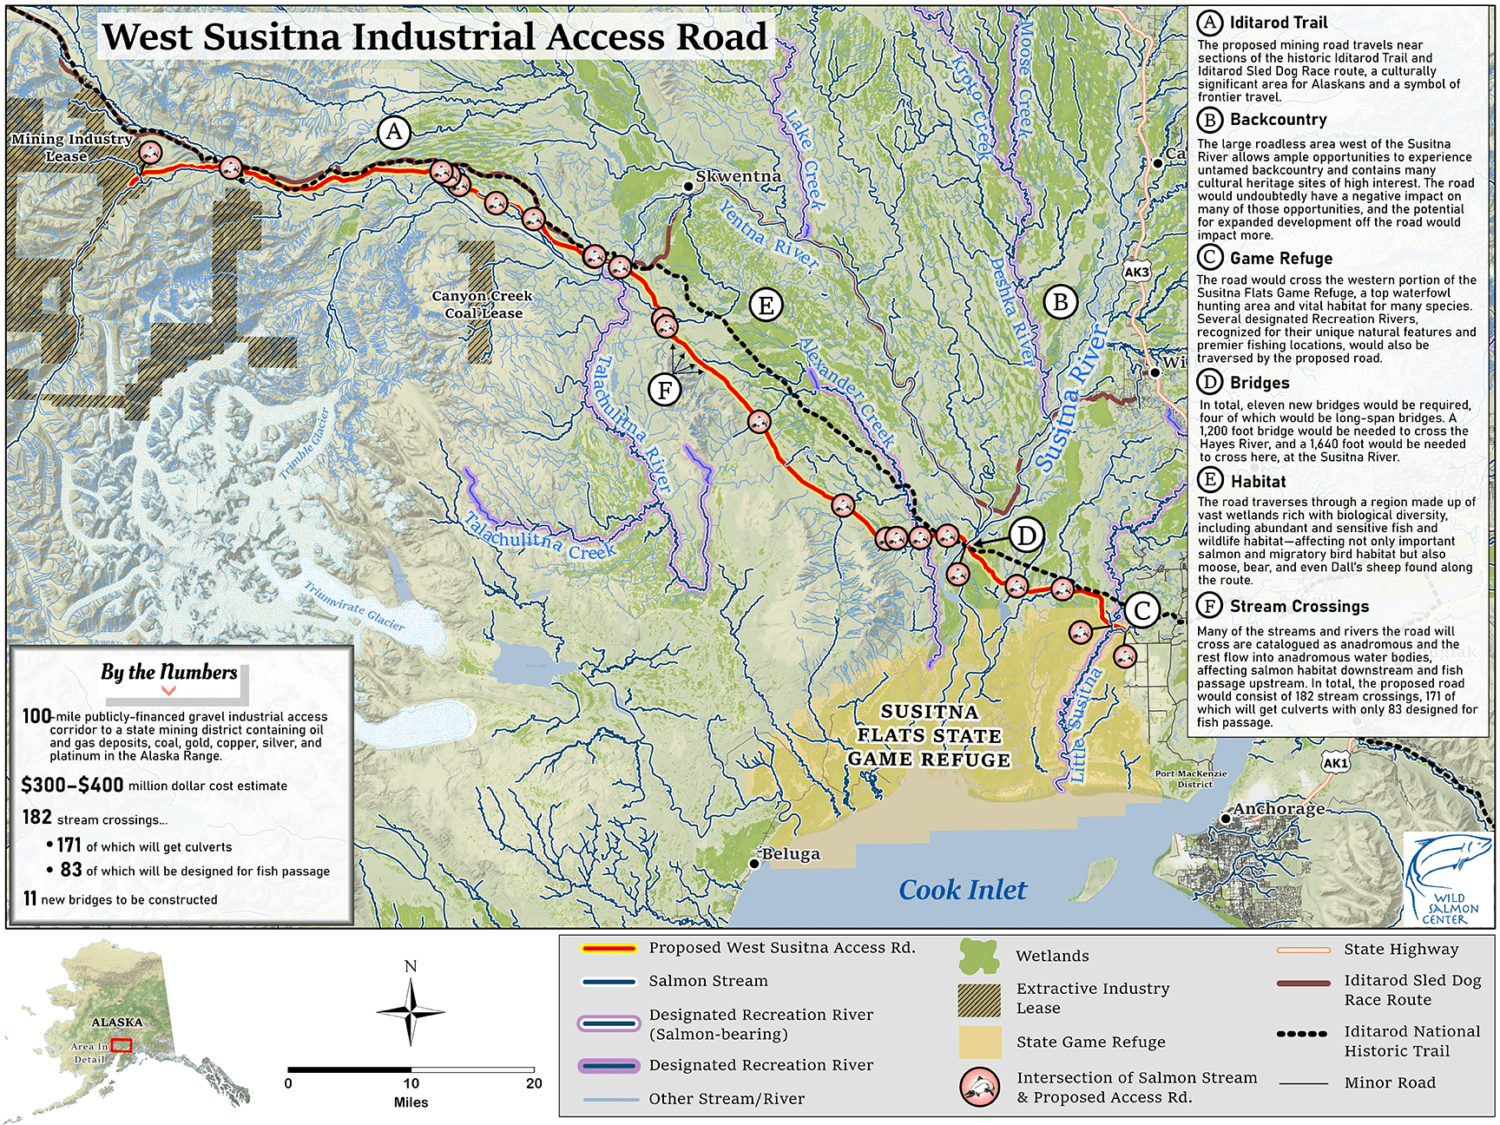
As WSC’s new GIS Spatial Analyst, Hart is already mining complex data to help our program staff and partners fight stream-beheading industrial roads in Alaska’s West Susitna watershed, evaluate the effects of snowpack retreat on salmon habitat, and perform habitat modeling for restoration projects on the Oregon coast.
For Hart, born and raised in Northern California, love of wilderness stemmed from his early days as a backcountry guide in Yosemite, along with long backpacking trips through the Sierra Nevadas.
“All I had was our little map set,” he laughs. “I’d spend hours in my tent trying to figure out our surroundings.”
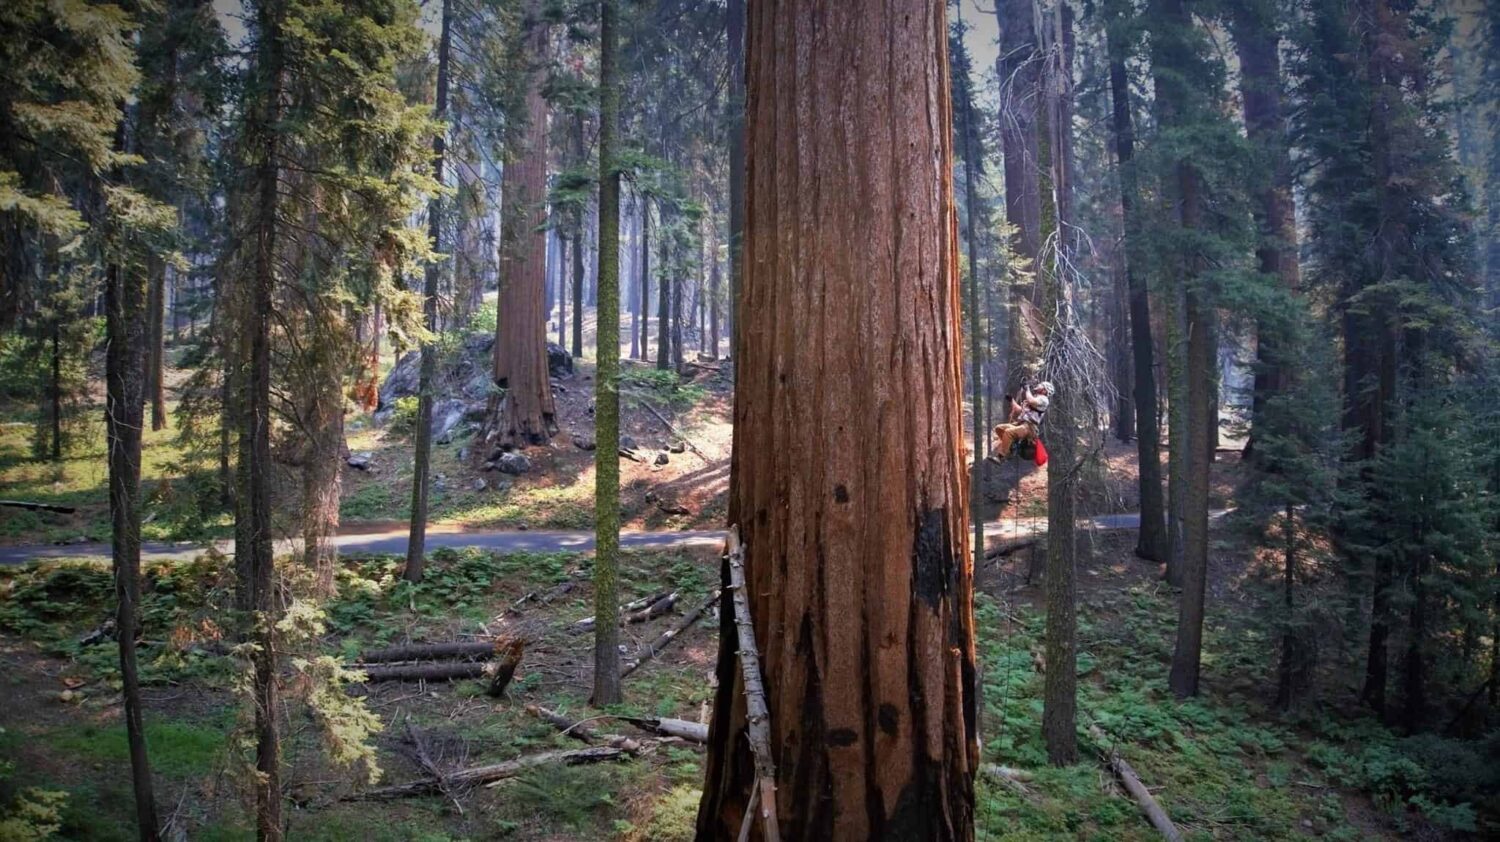
That need to see, explore, and truly understand the natural world carried through to 2016 work on the Leaf to Landscape project in Sequoia National Park. Working with researchers from the University of California-Berkeley, the U.S. Geological Survey, and the National Park Service, Hart and his survey team climbed into giant sequoia canopies to test the trees’ water stress, while deploying new LiDAR technology to map the canopy’s moisture content.
Through this work, Hart saw how the increasingly sophisticated tools of GIS analysis could accelerate conservation work. To expand his toolkit, he earned a Master of Environmental Science and Management degree from the Bren School at the UC-Santa Barbara, also serving as a Forest Sustainability Fellow.
Now, Hart is ready to apply these skills to protecting wild salmon habitat across the North Pacific. According to Hart, wild salmon are a “jackpot” species for making the case to conserve wild places. As a keystone species, salmon impact hundreds of other species, including humans, across landscapes that range from glacial moraines and mountains to coastal marshlands and beyond.
But distilling these complex messages into accessible, compelling visuals requires both a head for data and a keen eye for storytelling.
“You never really understand something until you can relate it to something else you already know,” he says. “When you lay out data in map form, patterns emerge, along with a universal language. A map really does paint the picture.”
Hart’s next picture to paint for WSC will support an ambitious new project from our science team. The aim is to create a comprehensive visual on spring Chinook population trends in the Western U.S., overlaid with meaningful data sets like future declines in snowpack, which impact the consistent supply of cold water that’s critical for this species.
“When you lay out data in map form, patterns emerge, along with a universal language. A map really does paint the picture.”
WSC GIS Spatial Analyst Jon Hart
“In many places, the status of spring Chinook populations is pressing,” Hart says. “To really capture public attention on this issue, we need a compelling image of where we stand currently—along with the conditions that shape where we’re heading.”
As with his work for BLM back in 2018, the stakes are high. But this time, his efforts will support efforts to build protections, rather than strip them away. It’s exactly the kind of project to prove, once again, the power of a picture to drive positive change.
Hero Image